A profitable-looking crypto trade can still be a poor trade if the potential reward is too small compared with the amount you could lose.
That is why traders use the crypto risk-to-reward ratio.
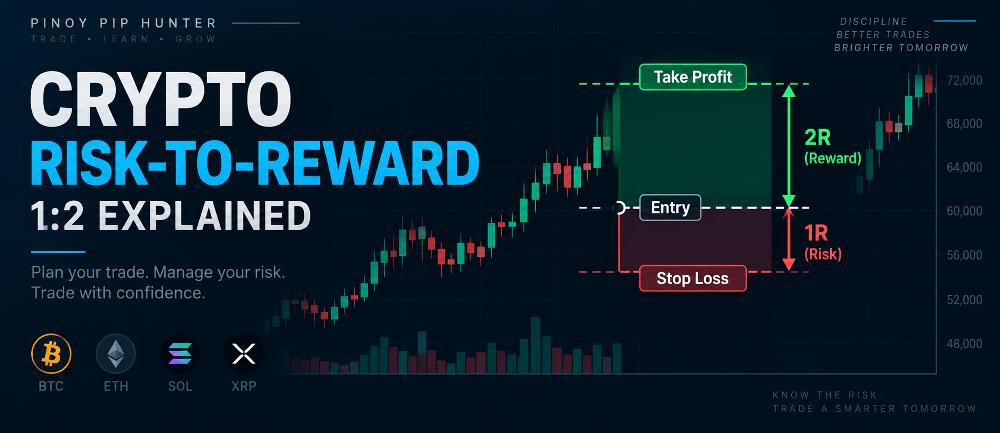
Risk-to-reward compares the amount you are prepared to lose if a trade fails with the amount you could potentially gain if the trade reaches its target.
For example, if you are willing to risk $100 to potentially make $200, your risk-to-reward ratio is:
1:2
You are risking one unit to pursue two units of potential reward.
The concept is simple, but using it correctly requires more than choosing a random 1:2 or 1:3 target. Your entry price, Stop Loss, Take Profit, position size, trading costs, win rate, and market structure all matter.
This guide explains how crypto risk-to-reward works, how to calculate it, what ratios such as 1:1, 1:2, and 1:3 mean, and why a higher ratio does not automatically make a trade better.
Important: This article is for educational purposes only and does not constitute financial, investment, or trading advice. Cryptocurrency markets are highly volatile. Stop Loss and Take Profit orders do not guarantee exact execution prices, and actual results may differ because of slippage, spread, fees, liquidity, gaps, and exchange-specific execution rules.
What Is Risk-to-Reward Ratio in Crypto Trading?
The risk-to-reward ratio compares:
Potential Loss : Potential Profit
Suppose you buy a cryptocurrency at:
Entry: $100
Your Stop Loss is:
$95
Your Take Profit is:
$110
Your potential loss per coin is:
$100 − $95 = $5
Your potential profit per coin is:
$110 − $100 = $10
Therefore:
Risk-to-Reward = $5 : $10
Simplified:
1:2
This means you are theoretically risking $1 for every $2 of potential reward.
Risk-to-reward should be planned before entering the trade, not calculated only after the position is already open.
CME Group emphasizes defining monetary risk, maximum trade loss, and risk/reward parameters as part of a structured trade plan. You can review its risk-management and trade-plan guidance for the broader principle.
Risk-to-Reward vs Reward-to-Risk: Do Not Mix Them Up
One common source of confusion is that traders and educational platforms sometimes reverse the terminology.
In this article, we use:
Risk-to-Reward = Risk : Reward
Therefore:
- Risk $100 to make $100 = 1:1
- Risk $100 to make $200 = 1:2
- Risk $100 to make $300 = 1:3
Some sources describe the same $100-risk/$200-reward trade as a 2:1 reward-to-risk ratio.
The trade itself is identical.
Only the order of the numbers changes.
For clarity, always ask:
How much am I risking, and how much am I targeting?
That is more useful than relying on the ratio label alone.
Crypto Risk-to-Reward Formula
The basic formula is:
Risk-to-Reward Ratio = Potential Loss ÷ Potential Profit
However, traders normally express the result in ratio form.
For a Long Trade
For a long position:
Risk = Entry Price − Stop-Loss Price
Reward = Take-Profit Price − Entry Price
Then compare:
Risk : Reward
Example
Entry:
$50
Stop Loss:
$48
Take Profit:
$56
Risk:
$50 − $48 = $2
Reward:
$56 − $50 = $6
Ratio:
$2 : $6
Simplified:
1:3
The trade therefore has a theoretical 1:3 risk-to-reward ratio before fees, spread, slippage, and other costs.
How to Calculate Risk-to-Reward for a Short Trade
For a short position, the direction is reversed.
Suppose:
Entry:
$100
Stop Loss:
$104
Take Profit:
$92
Potential risk:
$104 − $100 = $4
Potential reward:
$100 − $92 = $8
Risk-to-reward:
$4 : $8
Simplified:
1:2
The trader is theoretically risking one unit to pursue two units of reward.
The same concept therefore applies to both long and short positions.
What Does a 1:1 Risk-to-Reward Ratio Mean?
A 1:1 ratio means the potential profit is approximately equal to the potential loss.
Example:
Risk:
$100
Potential reward:
$100
If trading costs are ignored, a strategy using a 1:1 ratio would generally need to win more than half of its trades to remain profitable over time.
Why?
Because at exactly a 50% win rate:
10 trades × $100 risk/reward could produce approximately:
5 wins = +$500
5 losses = −$500
Net result:
$0 before trading costs
Once fees, spread, slippage, and funding are included, the strategy would need an edge beyond a simple 50% win rate.
What Does a 1:2 Risk-to-Reward Ratio Mean?
A 1:2 ratio means the potential reward is twice the planned risk.
Example:
Risk:
$100
Potential reward:
$200
One winning trade can theoretically offset two $100 losing trades before costs.
Suppose you take three trades:
Trade 1:
−$100
Trade 2:
−$100
Trade 3:
+$200
Total:
$0
That is why traders often consider 1:2 attractive.
However, this does not mean every crypto trade should automatically use a 1:2 target.
The market must realistically offer enough price movement for the target to make sense.
What Does a 1:3 Risk-to-Reward Ratio Mean?
A 1:3 ratio means you are risking one unit to potentially earn three.
Example:
Risk:
$100
Potential reward:
$300
This can allow a strategy to remain profitable with a lower win rate than a 1:1 strategy.
But there is a trade-off.
The farther your profit target is from your entry, the less frequently price may reach that target.
A 1:3 ratio therefore does not automatically outperform 1:2.
The correct question is not:
“Which ratio is highest?”
It is:
“Which combination of win rate and average reward produces positive expectancy for this strategy?”
Risk-to-Reward Ratio and Break-Even Win Rate
Risk-to-reward becomes much more useful when combined with break-even win rate.
Ignoring trading costs, the approximate break-even win rate is:
Break-Even Win Rate = Risk ÷ (Risk + Reward)
1:1 Risk-to-Reward
1 ÷ (1 + 1) = 50%
Approximate break-even win rate:
50%
1:2 Risk-to-Reward
1 ÷ (1 + 2) = 33.33%
Approximate break-even win rate:
33.33%
1:3 Risk-to-Reward
1 ÷ (1 + 3) = 25%
Approximate break-even win rate:
25%
Comparison Table
| Risk-to-Reward | Potential Risk | Potential Reward | Approx. Break-Even Win Rate* |
|---|---|---|---|
| 1:1 | $100 | $100 | 50% |
| 1:1.5 | $100 | $150 | 40% |
| 1:2 | $100 | $200 | 33.33% |
| 1:3 | $100 | $300 | 25% |
| 1:4 | $100 | $400 | 20% |
*Before fees, spread, slippage, funding, and execution differences.
The table demonstrates an important principle:
Higher potential reward can reduce the win rate required to break even mathematically.
But the actual win rate may also decline as the profit target becomes more ambitious.
Risk-to-Reward and Trading Expectancy
Risk-to-reward should not be analyzed by itself.
A more complete measure is trading expectancy.
A simplified formula is:
Expectancy = (Win Rate × Average Win) − (Loss Rate × Average Loss)
Suppose Strategy A has:
Win rate:
45%
Average winning trade:
2R
Loss rate:
55%
Average losing trade:
1R
Calculation:
(0.45 × 2R) − (0.55 × 1R)
= 0.90R − 0.55R
= +0.35R per trade
The theoretical expectancy is positive before costs.
Now consider Strategy B:
Win rate:
20%
Average winning trade:
3R
Loss rate:
80%
Average losing trade:
1R
Calculation:
(0.20 × 3R) − (0.80 × 1R)
= 0.60R − 0.80R
= −0.20R per trade
Even though Strategy B uses a larger 1:3 risk-to-reward target, its expectancy is negative in this example.
This is why a large reward target does not automatically create a profitable strategy.
What Is “R” in Crypto Trading?
Traders often use R to represent one unit of planned risk.
Suppose your maximum planned loss per trade is:
$50
Then:
1R = $50
If you lose $50:
−1R
If you make $100:
+2R
If you make $150:
+3R
This makes it easier to compare trades even when the position sizes or cryptocurrencies are different.
Kraken also describes “R” as a standardized unit of trade risk in its educational guide to bracket orders and reward-to-risk planning.
Risk-to-Reward Does Not Determine Position Size
This distinction is critical.
Suppose:
Account:
$10,000
Maximum risk:
1%
Maximum planned loss:
$100
Trade risk-to-reward:
1:2
Your potential profit target is approximately:
$200
But the 1:2 ratio does not tell you how many coins or contracts to trade.
Position size depends on:
- Account size
- Maximum monetary risk
- Entry price
- Stop-loss distance
For the complete calculation process, see our Crypto Position Sizing Explained guide.
A disciplined sequence is:
Account Risk → Stop-Loss Location → Position Size → Profit Target
—not:
Choose Large Position → Add Stop Loss → Hope for 1:2
Example: Combining Position Size and Risk-to-Reward
Suppose:
Account balance:
$5,000
Maximum planned risk:
1%
Risk amount:
$50
Crypto entry:
$100
Stop Loss:
$95
Take Profit:
$110
Step 1: Calculate Risk Per Coin
$100 − $95 = $5
Step 2: Calculate Position Size
$50 ÷ $5 = 10 coins
Position value:
10 × $100 = $1,000
Step 3: Calculate Potential Reward Per Coin
$110 − $100 = $10
Step 4: Calculate Total Potential Reward
10 × $10 = $100
Step 5: Calculate Risk-to-Reward
Risk:
$50
Potential reward:
$100
Risk-to-reward:
1:2
The trade therefore risks approximately 1% of the account to pursue a potential 2% account gain before costs.
Where Should Your Stop Loss Go?
A risk-to-reward ratio is only meaningful when the Stop Loss is placed logically.
Do not choose an arbitrary Stop Loss simply because it produces an attractive ratio.
For example, suppose your analysis suggests that a long trade becomes invalid below a major support level.
If that support is 6% below your entry, placing the stop only 2% away merely to manufacture a 1:3 ratio can expose the trade to normal market volatility.
A better sequence is:
- Identify the trade setup.
- Determine where the setup becomes invalid.
- Place the planned Stop Loss around that logical invalidation area.
- Calculate the required position size.
- Identify a realistic Take Profit.
- Calculate the resulting risk-to-reward ratio.
This principle is also part of the broader framework explained in our Crypto Risk Management for Beginners guide.
Where Should Your Take Profit Go?
The Take Profit should not be selected only because you want a particular ratio.
It should also make sense relative to market structure.
Possible profit-target references include:
- Previous swing highs
- Previous swing lows
- Support
- Resistance
- Range boundaries
- Breakout projections
- Trend structure
- Liquidity areas
- Volatility
- Strategy-specific exit rules
Suppose you want a 1:3 trade, but strong resistance sits at approximately 1.5R.
The market may offer only a realistic 1:1.5 opportunity.
Moving the Take Profit far beyond resistance simply to display 1:3 does not improve the trade.
Risk-to-reward should evaluate the setup.
It should not distort the setup.
Is 1:2 the Best Risk-to-Reward Ratio for Crypto?
There is no universal best crypto risk-to-reward ratio.
A 1:2 ratio is commonly used as an educational benchmark because the potential reward is twice the planned risk.
Kraken’s current spot risk-management guidance, for example, presents 2:1 reward-to-risk as one possible benchmark when planning trades. See its spot trading risk-management guidance.
But the best ratio for a specific strategy depends on factors such as:
- Historical win rate
- Market volatility
- Timeframe
- Trading style
- Stop-loss method
- Profit-taking method
- Fees
- Spread
- Slippage
- Liquidity
- Trend conditions
- Strategy expectancy
A profitable scalping system may operate differently from a swing-trading system.
There is no reason both must use the same fixed ratio.
Why a Very High Risk-to-Reward Ratio Can Be Misleading
A trade promising 1:5 may look better than a trade offering 1:2.
But the larger ratio may be unrealistic.
Suppose:
Trade A:
1:2 target
Historical win rate:
50%
Trade B:
1:5 target
Historical win rate:
10%
Ignoring costs:
Trade A
Expectancy:
(0.50 × 2R) − (0.50 × 1R)
= +0.50R
Trade B
Expectancy:
(0.10 × 5R) − (0.90 × 1R)
= −0.40R
The higher target did not create the better strategy.
The win rate and average realized outcome matter.
Planned Risk-to-Reward vs Actual Risk-to-Reward
Your planned ratio and actual result may differ.
Suppose you plan:
Risk:
$100
Reward:
$200
Planned risk-to-reward:
1:2
But the Stop Loss slips during a rapid market move and the actual loss becomes:
$120
Or the trader manually takes profit early at:
$130
The realized relationship is no longer 1:2.
Actual outcomes can change because of:
- Slippage
- Spread
- Fees
- Funding
- Partial fills
- Manual exits
- Trailing stops
- Partial profit-taking
- Exchange outages
- Sudden volatility
This is particularly relevant in crypto because market conditions can change quickly.
Trading Fees Can Change the Real Ratio
Suppose your planned trade is:
Risk:
$100
Reward:
$200
That looks like:
1:2
But assume total entry and exit costs reduce the winning outcome by $10.
Net reward:
$190
If losing trades also incur costs, the actual loss may exceed $100.
This matters most for:
- Scalping
- High-frequency trading
- Small profit targets
- Perpetual futures
- Illiquid altcoins
- Strategies with frequent entries
Your Crypto Risk Management for Beginners framework should therefore include trading costs rather than evaluating ratios in isolation.
Risk-to-Reward and Crypto Leverage
Leverage does not magically improve your risk-to-reward ratio.
Suppose your price setup is:
Entry:
$100
Stop:
$95
Take Profit:
$110
The underlying price relationship remains:
Risk:
5%
Reward:
10%
Risk-to-reward:
1:2
Using 2x, 5x, or 10x leverage changes your exposure and margin requirements.
It does not change the underlying price distances.
The danger appears when traders use leverage to increase position size beyond their planned monetary risk.
Before trading leveraged products, review our Crypto Leverage Explained for Beginners guide and Crypto Margin and Liquidation Explained.
Why Win Rate and Risk-to-Reward Must Be Evaluated Together
Consider two hypothetical strategies.
Strategy A
Win rate:
70%
Average risk-to-reward:
1:0.7
Strategy B
Win rate:
35%
Average risk-to-reward:
1:2.5
Either strategy could potentially be profitable.
The ratio alone does not tell you.
You need to know:
- Average win
- Average loss
- Win rate
- Loss rate
- Trading costs
- Number of trades
- Drawdown
- Execution quality
The correct objective is not to maximize one metric.
It is to build a positive-expectancy process with acceptable risk.
Common Crypto Risk-to-Reward Mistakes
Forcing Every Trade Into 1:2
A ratio should reflect the actual setup.
Some trades may provide 1:3.
Others may offer only 1:1.
If the available reward does not justify the risk according to your tested rules, skipping the trade may be better than manipulating the Stop Loss or target.
Making the Stop Loss Too Tight
A tighter stop mathematically improves the displayed ratio.
But if the Stop Loss sits inside ordinary market noise, it may reduce the strategy’s win rate.
Moving the Take Profit Too Far Away
A distant target can create an impressive theoretical ratio that price rarely reaches.
Ignoring Trading Costs
Fees and slippage reduce realized reward and can increase realized losses.
Increasing Position Size Because the Ratio Looks Good
A 1:3 trade can still cause serious account damage if the position is oversized.
Moving the Stop Loss Farther After Entry
Changing a planned $100 loss into a $300 loss destroys the original risk model.
Taking Profits Too Early Every Time
A strategy designed around 1:2 may not produce 1:2 expectancy if most winners are manually closed at 0.5R.
A Simple Crypto Risk-to-Reward Checklist
Before placing a trade, ask:
- What is my entry price?
- Where is my logical invalidation point?
- Where will my Stop Loss be?
- How much money am I willing to lose?
- What position size keeps the loss within that limit?
- Where is the realistic profit target?
- What is the resulting risk-to-reward ratio?
- Does the ratio fit my tested strategy?
- What win rate has the strategy historically produced?
- Have I included fees, spread, slippage, and funding?
- Am I using leverage?
- Could liquidation occur before my intended Stop Loss?
- Is the potential reward realistic based on market structure?
This process makes risk-to-reward part of a complete risk plan rather than a standalone number.
Frequently Asked Questions
What is a good risk-to-reward ratio for crypto?
There is no single ratio that is best for every strategy. Ratios such as 1:2 are commonly used as planning benchmarks, but the appropriate ratio depends on win rate, market structure, timeframe, trading costs, volatility, and the strategy’s historical expectancy.
Is a 1:2 risk-to-reward ratio good?
A 1:2 ratio means risking one unit to potentially earn two. Mathematically, the approximate break-even win rate is 33.33% before trading costs. Whether it is good depends on how often the strategy actually reaches its target.
Is 1:3 better than 1:2?
Not automatically. A 1:3 target offers more potential reward per unit of risk, but the target may be reached less frequently. The better ratio is the one that produces stronger expectancy after considering the strategy’s win rate and costs.
Can a strategy be profitable with a 1:1 ratio?
Yes. A strategy with a sufficiently high win rate and controlled costs may be profitable with a 1:1 ratio.
Can I use risk-to-reward without a Stop Loss?
You need a defined risk point to calculate meaningful risk-to-reward. That risk point does not have to use the same order type in every strategy, but you must know where and how the trade will be exited if the idea fails.
Does leverage improve risk-to-reward?
No. Leverage changes exposure and margin usage. It does not improve the underlying relationship between the entry, Stop Loss, and Take Profit.
Does a 1:2 ratio mean I will make twice as much as I lose?
Only on a trade that reaches the intended target and exits near the planned price. Actual results can differ because of fees, slippage, partial exits, funding, and execution.
Should beginners always use 1:2?
No. Beginners should first learn to place logical stops, calculate position size, control account risk, and test whether a chosen ratio fits their trading strategy.
Final Thoughts
The crypto risk-to-reward ratio helps answer a simple but important question:
Is the potential reward of this trade sufficient relative to the amount I am prepared to lose?
A trade risking $100 to target $200 has a theoretical risk-to-reward ratio of:
1:2
But that number does not determine whether the strategy will be profitable.
Risk-to-reward must be evaluated together with:
- Win rate
- Position sizing
- Stop-loss quality
- Profit-target realism
- Trading costs
- Leverage
- Slippage
- Execution
- Overall expectancy
The most disciplined process is:
Define Risk → Place Logical Stop → Calculate Position Size → Set Realistic Target → Measure Risk-to-Reward → Evaluate Expectancy
If you are still building your crypto risk framework, start with our Crypto Position Sizing Explained and Crypto Risk Management for Beginners guides.
Risk-to-reward is not a promise of profit.
It is a planning tool designed to help you decide whether the potential upside of a trade justifies the downside you are accepting.
Risk Disclaimer: Cryptocurrency trading can result in substantial losses. Risk-to-reward calculations are theoretical and do not guarantee actual execution or profitability. Fees, spread, slippage, liquidity, leverage, liquidation, funding costs, platform outages, and sudden market movements can materially change realized results.



Be the first to comment