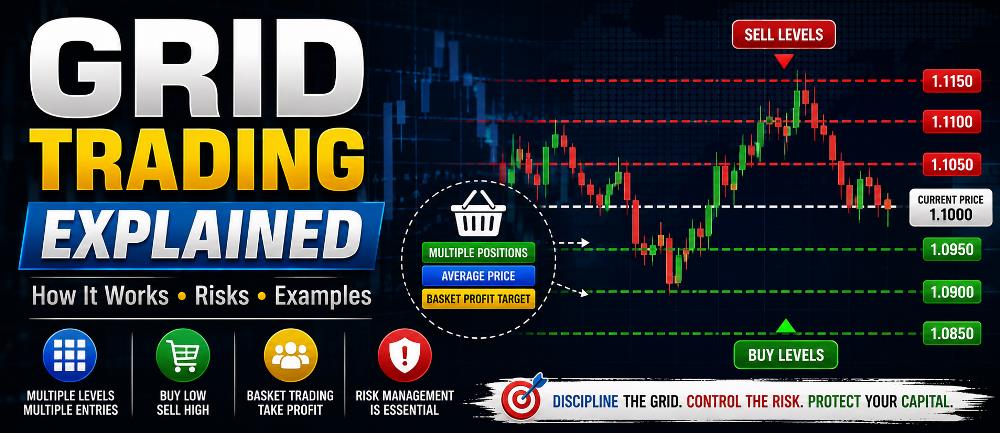
Grid trading is a strategy that places multiple buy or sell orders at predetermined price intervals instead of relying on a single entry.
The basic idea is simple.
Rather than trying to predict the exact point where the market will reverse or continue trending, a grid trader creates a series—or grid—of trading levels above and below the current market price.
As price moves through those levels, additional trades may be opened.
Grid trading can be performed manually, but because it may require managing many positions simultaneously, it is frequently associated with automated trading systems and Expert Advisors (EAs).
However, grid trading carries an important risk that beginners must understand:
A grid can accumulate significant exposure when the market moves strongly in one direction.
A strategy that appears to generate many small winning trades can therefore experience a large drawdown when market conditions change.
In this guide, we will explain what grid trading is, how a trading grid works, the difference between fixed-lot and increasing-lot grids, why grid strategies can experience large drawdowns, and what traders should examine before using a grid EA.
Important: This article is for educational purposes only and does not constitute financial or investment advice. Trading leveraged products involves substantial risk, and losses can exceed expectations when multiple positions are open simultaneously.
What Is Grid Trading?
Grid trading is a trading method in which multiple orders or positions are placed at predefined price intervals.
Imagine the market is currently trading at:
1.1000
A trader might establish grid levels every 50 points:
- 1.0950
- 1.1000
- 1.1050
- 1.1100
- 1.1150
The strategy then determines what should happen when price reaches each level.
Depending on the system, it may:
- Open additional BUY positions as price falls
- Open additional SELL positions as price rises
- Place pending orders above and below market price
- Trade in both directions
- Close individual trades at predetermined profits
- Close an entire group of trades when a basket target is reached
The exact behavior depends on how the grid strategy was designed.
This is an important point:
Grid trading is not one single strategy.
Two trading systems can both be described as grid strategies while using completely different entry, sizing, exit, and risk-management rules.
How Does Grid Trading Work?
To understand grid trading, imagine price levels arranged like horizontal lines across a chart.
For example:
1.1200
----------------

1.1150
----------------

1.1100
----------------

1.1050
----------------

1.1000
----------------
Each line represents a possible trading level.
The distance between those levels is called the:
Grid spacing
or
Grid interval
If the spacing is 50 points, another position may potentially be opened every time price travels another 50 points.
The grid can continue until:
- A profit target is reached
- A maximum number of trades is reached
- A stop-loss condition is triggered
- A basket profit target is reached
- The trader manually closes the positions
- The EA’s exit condition occurs
This differs significantly from a conventional single-entry trade.
Traditional Trading vs Grid Trading
Consider a conventional trade.
A trader might:
- Identify an entry
- Open one position
- Set a stop loss
- Set a take profit
- Wait for the outcome
For example:
BUY EURUSD at 1.1000
Stop Loss:
1.0950
Take Profit:
1.1100
Only one position is involved.
A grid strategy may instead open additional positions as price changes.
For example:
BUY #1 — 1.1000
BUY #2 — 1.0950
BUY #3 — 1.0900
BUY #4 — 1.0850
BUY #5 — 1.0800
Instead of having one entry price, the strategy now has several.
This changes both the potential reward and the risk.
What Is a Grid Basket?
Multiple positions belonging to the same grid are commonly treated as a basket.
Instead of managing every position independently, the trading system may calculate the combined profit or loss of all positions.
For example:
| Trade | Entry | Current Result |
|---|---|---|
| BUY #1 | 1.1000 | -$40 |
| BUY #2 | 1.0950 | -$20 |
| BUY #3 | 1.0900 | +$10 |
The total basket result is:
-$50
If price subsequently rises, all three positions may improve simultaneously.
The strategy might be programmed to close the complete basket once total profit reaches:
+$20
This is known as a basket profit target.
What Is the Average Entry Price in Grid Trading?
One reason traders use grids is that additional entries change the average entry price.
Suppose a trader opens:
BUY 0.10 lot at 2,000
BUY 0.10 lot at 1,990
BUY 0.10 lot at 1,980
Because all positions use equal volume, the approximate average entry becomes:
1,990
Price therefore does not necessarily need to return to the first entry at 2,000 before the complete basket can recover.
This is the mathematical attraction behind many averaging grids.
But there is another side to the calculation.
Every additional position also increases total market exposure.
That means losses can accelerate if the market continues moving against the grid.
What Is Grid Spacing?
Grid spacing is the distance between successive grid entries.
For example:
First BUY: 2,000
Second BUY: 1,995
Third BUY: 1,990
Fourth BUY: 1,985
The grid spacing is:
5.00
Some strategies use fixed spacing.
Others use dynamic spacing based on factors such as:
- Volatility
- Average True Range (ATR)
- Market structure
- Support and resistance
- Trading session
- Recent price range
Grid spacing can dramatically affect strategy behavior.
Tight Grid
A tight grid opens positions frequently.
Potential consequences include:
- More trades
- Faster accumulation of exposure
- Higher spread and commission costs
- Greater margin usage
- Larger baskets during strong trends
Wide Grid
A wider grid may produce:
- Fewer entries
- Slower exposure growth
- Larger distance between trades
- Longer recovery periods
Neither approach is automatically safer.
Risk depends on the complete strategy.
What Is a Fixed-Lot Grid?
A fixed-lot grid uses approximately the same position size for each additional entry.
For example:
BUY #1 — 0.10 lot
BUY #2 — 0.10 lot
BUY #3 — 0.10 lot
BUY #4 — 0.10 lot
BUY #5 — 0.10 lot
After five trades, the total nominal volume is:
0.50 lot
This is relatively straightforward to understand.
However, risk still increases as more positions are added because total exposure increases.
Five 0.10-lot positions do not carry the same exposure as one 0.10-lot position.
What Is an Increasing-Lot Grid?
Some grid strategies increase position size with each additional trade.
For example:
Trade #1 — 0.01 lot
Trade #2 — 0.02 lot
Trade #3 — 0.04 lot
Trade #4 — 0.08 lot
Trade #5 — 0.16 lot
Total exposure after five positions becomes:
0.31 lot
Even though the first trade was only 0.01 lot.
This type of position progression can cause exposure to increase extremely quickly.
Is Grid Trading the Same as Martingale?
No.
Grid trading and martingale are not automatically the same thing.
A grid describes how multiple trades are distributed across price levels.
Martingale generally refers to increasing position size following adverse outcomes or additional entries, often using a multiplier.
A grid can therefore use:
Fixed Lot Size
0.10
0.10
0.10
0.10
0.10
or increasing sizes such as:
0.10
0.15
0.23
0.34
0.51
The first is a grid without aggressive lot progression.
The second combines grid behavior with increasing position sizing.
This distinction is extremely important when evaluating an Expert Advisor.
Simply asking:
“Does this EA use a grid?”
is not enough.
You should also ask:
“How does the EA calculate the lot size of each additional position?”
Why Do Traders Use Grid Trading?
Grid trading has several characteristics that can make it attractive.
1. It Does Not Require a Perfect Entry
Many traders struggle to identify an exact market turning point.
A grid distributes entries across multiple price levels instead.
2. It Can Benefit From Market Oscillation
Markets frequently move up and down within ranges.
A well-designed grid may potentially capture repeated price movements when the market oscillates between different levels.
3. Average Entry Price Can Improve
Additional entries can move the basket’s average entry closer to the current market price.
This may allow a basket to recover after a smaller reversal than the original trade would require.
4. Grid Trading Can Be Automated
Grid strategies often involve repetitive calculations and order management.
An Expert Advisor can automatically manage:
- Grid spacing
- Position entries
- Lot sizes
- Maximum trades
- Basket profit
- Stop losses
- Trading sessions
- Drawdown limits
- Exit rules
If you are new to automated systems, read our guide to Algorithmic Trading for Beginners.
You can also learn how to install an Expert Advisor in MT5 before experimenting with automated strategies.
Why Is Grid Trading Risky?
The greatest weakness of many grid strategies appears when the market moves strongly in one direction without making a sufficient reversal.
Imagine a BUY grid:
BUY at 2,000
BUY at 1,990
BUY at 1,980
BUY at 1,970
BUY at 1,960
BUY at 1,950
The strategy expects price eventually to recover.
But what happens if price continues:
1,940
1,930
1,920
1,900
1,880
The existing positions continue losing while additional trades may continue being opened.
Three things can rise simultaneously:
Floating loss
Margin usage
Total market exposure
This is why grid strategies can sometimes show a very high percentage of profitable baskets while still carrying substantial tail risk.
Grid Trading and Drawdown
Drawdown is particularly important when evaluating grid systems.
Suppose an EA regularly makes small profits:
+$10
+$15
+$12
+$18
+$14
+$11
The performance may initially appear stable.
But one prolonged basket could eventually reach:
-$500
or more.
Looking only at win rate would therefore provide an incomplete picture.
Important metrics include:
- Maximum drawdown
- Relative drawdown
- Maximum floating loss
- Maximum simultaneous positions
- Maximum lot exposure
- Margin usage
- Longest basket duration
- Largest losing basket
- Recovery factor
This is why traders evaluating grid EAs should understand maximum drawdown, not just net profit or win rate.
Grid Trading and Margin
Every open leveraged position normally requires margin.
As a grid adds more positions, total margin usage can increase.
For example, a strategy might begin with:
0.01 lot
which appears extremely small.
But after multiple grid entries, the account might hold:
10 × 0.01 lot
or significantly more if lot sizes increase.
The correct question is therefore not:
“What is the starting lot size?”
A more useful question is:
“What is the maximum total exposure the strategy can accumulate?”
This is especially important for leveraged products.
Position size should always be evaluated relative to account equity and possible adverse price movement.
For gold traders, our XAUUSD Risk Management Guide explains why position sizing, leverage, and account exposure must be controlled carefully.
Grid Trading on XAUUSD
Grid trading is frequently discussed in connection with XAUUSD or gold trading.
Traders should be particularly cautious here because gold can experience large directional moves during:
- Major economic announcements
- Central-bank decisions
- Inflation data
- Employment reports
- Geopolitical events
- Changes in interest-rate expectations
- Periods of market stress
A grid that operates comfortably during relatively quiet conditions can behave very differently when volatility suddenly expands.
Gold traders should therefore understand the instrument before applying any automated strategy.
You can start with our guide explaining What Is XAUUSD?.
Trading costs also matter when a grid opens numerous positions. Read our guide to XAUUSD Spread Explained to understand how Bid/Ask spreads affect gold trades.
Can Grid Trading Work in Trending Markets?
It depends entirely on the strategy.
Some grids are designed for ranging markets.
Others attempt to trade with the trend.
A dangerous scenario occurs when a counter-trend grid continuously adds positions against a powerful directional move.
For example:
A SELL grid might keep selling as price rises.
If the market eventually reverses, the basket may recover.
But there is no guarantee that price will reverse before the strategy reaches:
- Its maximum number of positions
- Its maximum drawdown
- Its stop loss
- Its margin limit
Markets can move farther than expected and remain directional longer than a trading account can tolerate.
What Is a Trend-Following Grid?
Not every grid averages against price.
A strategy can instead add positions in the direction of a trend.
For example:
BUY #1 — 1.1000
BUY #2 — 1.1050
BUY #3 — 1.1100
BUY #4 — 1.1150
In this case, positions are added as price moves upward.
This resembles scaling into a winning trend rather than averaging into a losing position.
However, trend-following grids have different risks.
If the trend suddenly reverses, several previously profitable positions may become losing positions.
Again, grid trading itself does not determine whether a strategy is safe or profitable.
The complete trading logic matters.
What Is a Hedged Grid?
Some grid systems can maintain BUY and SELL positions simultaneously.
For example:
BUY positions below market
SELL positions above market
or a strategy may open an opposing position after a certain market movement.
This is sometimes described as a hedged grid.
However, opening positions in opposite directions does not automatically eliminate risk.
Depending on the broker’s account type and the strategy’s rules, hedging can:
- Lock floating losses
- Increase transaction costs
- Increase complexity
- Require additional margin
- Make basket exits more difficult
A hedging mechanism therefore needs its own clear exit strategy.
What Is a Basket Take Profit?
A basket take profit closes multiple positions when their combined profit reaches a target.
For example:
Trade #1 = -$20
Trade #2 = -$5
Trade #3 = +$15
Trade #4 = +$25
Combined basket result:
+$15
If the EA’s basket profit target is $15, it may close all four positions.
This differs from assigning an independent take-profit level to every trade.
Basket management is common in automated grid systems because the average entry price changes whenever a new position is added.
Should a Grid Strategy Have a Stop Loss?
A grid strategy needs some method of defining maximum acceptable risk.
That does not necessarily mean every system uses an identical conventional stop loss.
Risk controls might include:
- Individual trade stop losses
- Basket stop loss
- Maximum monetary loss
- Maximum percentage drawdown
- Maximum number of positions
- Maximum total lot exposure
- Equity protection
- Margin protection
- Time-based exit
- Volatility filter
- Emergency shutdown
The crucial issue is whether the strategy has a clearly defined point at which it accepts that its market assumption was wrong.
A grid with unlimited entries and no practical loss limit can expose an account to severe risk.
Why Can Grid EAs Look Very Profitable in Backtests?
Many grid systems can produce attractive equity curves during favorable historical periods.
Several characteristics can contribute to this appearance:
- Frequent small basket profits
- High win rate
- Long periods without realized losses
- Averaging of losing positions
- Positions remaining open until price recovers
The danger is that a conventional balance curve may not always communicate the full floating exposure carried by open positions.
When examining a grid backtest, pay attention to both:
Balance
and
Equity
Large gaps between them can indicate significant unrealized losses.
Backtest a Grid EA Before Using It
MetaTrader 5 includes a Strategy Tester that allows Expert Advisors to be evaluated using historical market data.
A grid EA should be tested across different market conditions rather than only a short favorable period.
Consider testing periods containing:
- Strong trends
- Sideways markets
- High volatility
- Low volatility
- Major economic events
- Sudden reversals
- Extended directional movements
Important statistics include:
- Net profit
- Maximum drawdown
- Profit factor
- Recovery factor
- Total trades
- Maximum consecutive losses
- Maximum simultaneous positions
- Equity behavior
- Margin usage
Historical performance does not guarantee future results.
Backtesting is primarily a tool for understanding how the strategy behaves and where it may fail.
Official MetaTrader documentation on the MetaTrader 5 Strategy Tester explains how Expert Advisors can be evaluated and optimized using historical data.
Forward-Test the Grid on Demo
Backtesting should not be the final step.
A grid EA can also be observed on a demo account under current market conditions.
Forward testing can expose issues involving:
- Real spreads
- Slippage
- Execution
- Trading sessions
- Broker specifications
- Swap
- Commission
- Server interruptions
- EA errors
- Unexpected basket behavior
Observe how the EA behaves when trades move significantly against it.
The most important test is often not how quickly it makes money.
It is:
What does the strategy do when the market refuses to return?
Important Grid EA Settings to Check
Before using a grid Expert Advisor, understand every important risk parameter.
Initial Lot Size
The size of the first position.
Do not evaluate this number alone.
Lot Multiplier
Determines whether subsequent positions become larger.
For example:
Multiplier = 2.0
could potentially create:
0.01
0.02
0.04
0.08
0.16
depending on the EA’s implementation.
Grid Distance
Determines how far price must move before another position is opened.
Maximum Trades
Sets the maximum number of simultaneous grid positions.
A finite maximum can help prevent theoretically unlimited position accumulation, although it does not eliminate risk.
Maximum Lot Size
Some systems place a ceiling on the position size of later grid entries.
Basket Take Profit
Closes the basket after reaching a defined combined profit.
Basket Stop Loss
Closes the complete basket when total loss reaches a predefined threshold.
Maximum Drawdown Protection
Some EAs stop trading or close positions after equity drawdown reaches a defined percentage or monetary value.
Trading Session Filter
Restricts grid activity to specified market hours.
News Filter
Some strategies attempt to avoid opening new trades around major economic announcements.
No filter can eliminate market risk, but controlling when new exposure may be added can form part of a broader risk-management system.
Example of Grid Exposure Growth
Consider a fixed-lot strategy using:
0.10 lot per position
After one entry:
Total volume = 0.10 lot
After five entries:
Total volume = 0.50 lot
After ten entries:
Total volume = 1.00 lot
Now compare that with an increasing-lot strategy:
0.01
0.02
0.04
0.08
0.16
0.32
0.64
After only seven entries, the total volume becomes:
1.27 lots
That is why traders should never judge grid risk from the starting lot size alone.
Advantages of Grid Trading
Potential advantages include:
Multiple Entry Levels
The strategy does not rely completely on one exact entry price.
Systematic Execution
Rules can be predetermined rather than improvised during a trade.
Automation Friendly
Grid calculations can be efficiently handled by Expert Advisors.
Potentially Suitable for Oscillating Markets
Some grids are designed to exploit repeated movement within a range.
Basket-Based Management
Multiple positions can be managed as one combined trading cycle.
Disadvantages of Grid Trading
Important disadvantages include:
Increasing Exposure
Every additional entry can increase account exposure.
Large Drawdown
A prolonged directional move can create substantial floating losses.
Margin Pressure
Multiple simultaneous positions consume additional margin.
Trading Costs
More trades can mean more spread, commission, and potentially swap costs.
False Sense of Security From High Win Rate
Many small profitable baskets do not guarantee long-term safety.
Dependence on Market Behavior
A strategy designed around price returning toward an average can struggle when a strong trend persists.
Complexity
Managing ten positions is considerably more complicated than managing one.
Is a High Win Rate Enough?
No.
Suppose a grid strategy wins:
95 out of 100 baskets.
That sounds impressive.
But imagine:
Average winning basket = +$10
Ninety-five winners produce:
+$950
Now imagine the five losing baskets average:
-$300
Total losses become:
-$1,500
Overall result:
-$550
The strategy has:
95% win rate
but still loses money.
This is why win rate should never be evaluated independently.
Questions to Ask Before Using a Grid EA
Before running a grid Expert Advisor, determine:
- What triggers the first trade?
- What triggers additional grid entries?
- What is the grid spacing?
- Is grid spacing fixed or dynamic?
- Does lot size remain constant?
- Is there a lot multiplier?
- What is the maximum number of positions?
- What is the maximum total volume?
- Does the system use a stop loss?
- Is there a basket stop loss?
- Does it have drawdown protection?
- What happens during a strong trend?
- What happens during major news?
- What is the maximum historical drawdown?
- What happens if the trading platform disconnects?
- How are positions closed?
- Does it hold positions overnight?
- What spread, commission, and swap costs apply?
If you cannot answer these questions, you probably do not yet fully understand the system’s risk.
Grid Trading Risk Management
Risk management should be designed around the entire basket, not merely the first trade.
Important controls may include:
Limit Maximum Positions
Prevent unlimited trade accumulation.
Limit Total Lot Exposure
Determine the maximum combined position size before trading.
Use Conservative Starting Volume
A small first position does not guarantee safety, but excessive starting volume can cause risk to increase much faster.
Define Maximum Drawdown
Know how much equity loss is acceptable before the strategy must stop.
Avoid Assuming Price Must Reverse
The market has no obligation to return to your average entry.
Test Extreme Conditions
Evaluate how the grid behaves during prolonged directional movement.
Monitor Margin
Account survival is more important than keeping a losing basket open indefinitely.
The CFTC also warns traders that leveraged forex trading can magnify losses and that traders should only risk capital they can afford to lose:
CFTC – Eight Things You Should Know Before Trading Forex
Can Grid Trading Be Profitable?
A grid strategy can generate profitable periods, just like many other trading approaches.
But no grid is automatically profitable.
Its results depend on factors including:
- Entry logic
- Grid spacing
- Position sizing
- Market conditions
- Exit logic
- Maximum exposure
- Transaction costs
- Risk controls
- Broker execution
- Instrument volatility
Most importantly:
Profitability should be evaluated together with drawdown and risk of ruin.
A system that earns 30% while risking nearly the entire account is fundamentally different from one producing lower returns with tightly controlled exposure.
Is Grid Trading Good for Beginners?
Beginners should understand grid trading before considering using it.
The concept of opening multiple positions is easy to understand.
The risk mathematics are not always as obvious.
A beginner may see:
0.01 lot
and assume the strategy is low risk.
But the EA may eventually accumulate many positions or increase later lot sizes substantially.
Before experimenting with a grid system:
- Learn position sizing
- Understand margin
- Understand leverage
- Learn how drawdown works
- Understand the difference between balance and equity
- Backtest the strategy
- Forward-test it on demo
- Understand every EA input
Automation should never replace risk understanding.
Frequently Asked Questions About Grid Trading
What is grid trading?
Grid trading is a strategy that opens or places multiple trading positions at predetermined price intervals rather than relying on one single entry.
What is grid spacing?
Grid spacing is the price distance between successive grid levels.
What is a grid basket?
A grid basket is a group of related positions managed together, often using a combined profit or loss target.
Is grid trading the same as martingale?
No. Grid trading refers to multiple entries distributed across price levels. Martingale generally involves increasing position size following adverse outcomes or additional entries. A grid can use fixed position sizes without using martingale-style sizing.
Why is grid trading risky?
A grid can accumulate multiple losing positions during a strong directional market move, causing floating loss, total exposure, margin usage, and drawdown to increase simultaneously.
Can a grid EA lose an entire account?
Any leveraged trading system can potentially create severe losses when exposure is inadequately controlled. Grid systems without effective limits on position accumulation, total volume, drawdown, or losses can be particularly vulnerable during prolonged adverse moves.
Are grid EAs profitable?
Some grid EAs may show profitable historical or forward-testing periods, but there is no guarantee that future market conditions will produce the same results.
Is a fixed-lot grid safer than martingale?
Fixed lot sizing generally causes exposure to grow more slowly than an aggressively increasing lot sequence, but that does not make a fixed-lot grid automatically safe. Multiple positions can still produce substantial losses.
Should I backtest a grid EA?
Yes. Backtesting can help reveal drawdown, exposure growth, basket duration, and performance under different historical market conditions. Historical results, however, cannot guarantee future performance.
Can grid trading be automated?
Yes. Grid strategies are frequently automated using Expert Advisors because EAs can calculate grid levels, manage multiple positions, monitor basket profit, and enforce programmed risk rules automatically.
Final Thoughts
Grid trading is much more than simply opening several trades at different prices.
A complete grid strategy must define:
- Where the first trade begins
- When another position is added
- Grid spacing
- Position sizing
- Maximum number of trades
- Maximum total exposure
- Basket profit targets
- Stop-loss rules
- Drawdown protection
- Exit conditions
The attraction of grid trading is understandable.
Multiple entries can improve the average entry price, and repeated market oscillations may allow baskets to close profitably.
But the same mechanism creates its greatest risk.
Every additional position adds exposure.
When the market continues strongly against a grid, floating loss and margin requirements can increase rapidly—particularly when the strategy also increases position size.
Therefore, do not evaluate a grid EA based solely on:
- Win rate
- Starting lot size
- Daily profit
- Number of winning baskets
- A smooth-looking balance curve
Instead, examine:
Maximum drawdown, equity behavior, total exposure, position progression, margin requirements, and what happens during the strategy’s worst market conditions.
Grid trading is ultimately a method of managing multiple entries.
Whether it becomes a controlled trading strategy or an excessive-risk strategy depends on the rules governing those entries.
Understanding those rules should always come before risking real capital.


2 Trackbacks / Pingbacks